*** UPDATE ***
My domain gmt.io is being sold.
Updating links in this article to point to the legacy domain gmtaz.com
COVID-19 needs no introduction. After taking a look at the incredible dashboard the JHU and ESRI team put together, I was inspired to see how I could visualize the spread of the virus over the reported time. I couldn't find this anywhere online, so I decided to build it.
I tried a bunch of different visualization / mapping tools before landing back on ESRI's ArcGIS Javascript library. Here's a quick list, and the drawbacks, of other tools I tried:
- Salesforce Einstein Analytics (because, duh)
- Could not easily unpivot the dataset
- Didn't have an easy way to automate visualization or data updates - Tableau
- Slow (Based on another online example)
- Automation issues - ElasticSearch + Kibana
- Also slow
- Didn't filter quite how I wanted it to (probably my fault)
- No automated slider widget
So, as I mentioned, I landed back on ArcGIS because they have some great examples, documentation, and I could do exactly what I wanted to do (and fairly quickly - in about 18 hours with ZERO previous ArcGIS JS experience).
Stepping back for a second... my thought process here was to figure this out in steps:
- Framework to build the front end
- Server stack
- Hosting (update at the bottom)
- Caching and Performance
I settled on ArcGIS for the framework for the front end. For the server stack, I was pretty sure I wanted to do something with NodeJS or Python (thanks to Carl Brundage for introducing me to Python Pandas.melt()) - but I still needed to host that somewhere. I thought about trying to build this out serverless, but I wanted to host this for "free" (I'm already paying for a Digital Ocean virtual server). I looked at Azure Functions, AWS Lambdas, and because I wanted to make sure I didn't hit any overages (and was having some trouble getting my dependencies to import into these services), I settled back to my VPC on DO.
After exploring Python vs NodeJS a bit more, I settled on NodeJS because I'd rather deal with Express than Python uWSGI and nginx. I also know Javascript way better than Python (which is to say, "at all") and have my dev environment set up for it.
The last consideration I had was caching and performance. This led me to a couple of different solutions, but ultimately I settled on some free options:
- Cloudflare (because I already use it and love the service)
- Nginx proxy cache
- Browser cache
The data only changes once per day, so I could have a pretty strong caching architecture in place for relatively little effort.
Cool, so here's how it all works (and I'm sure there are more ways to optimize this):
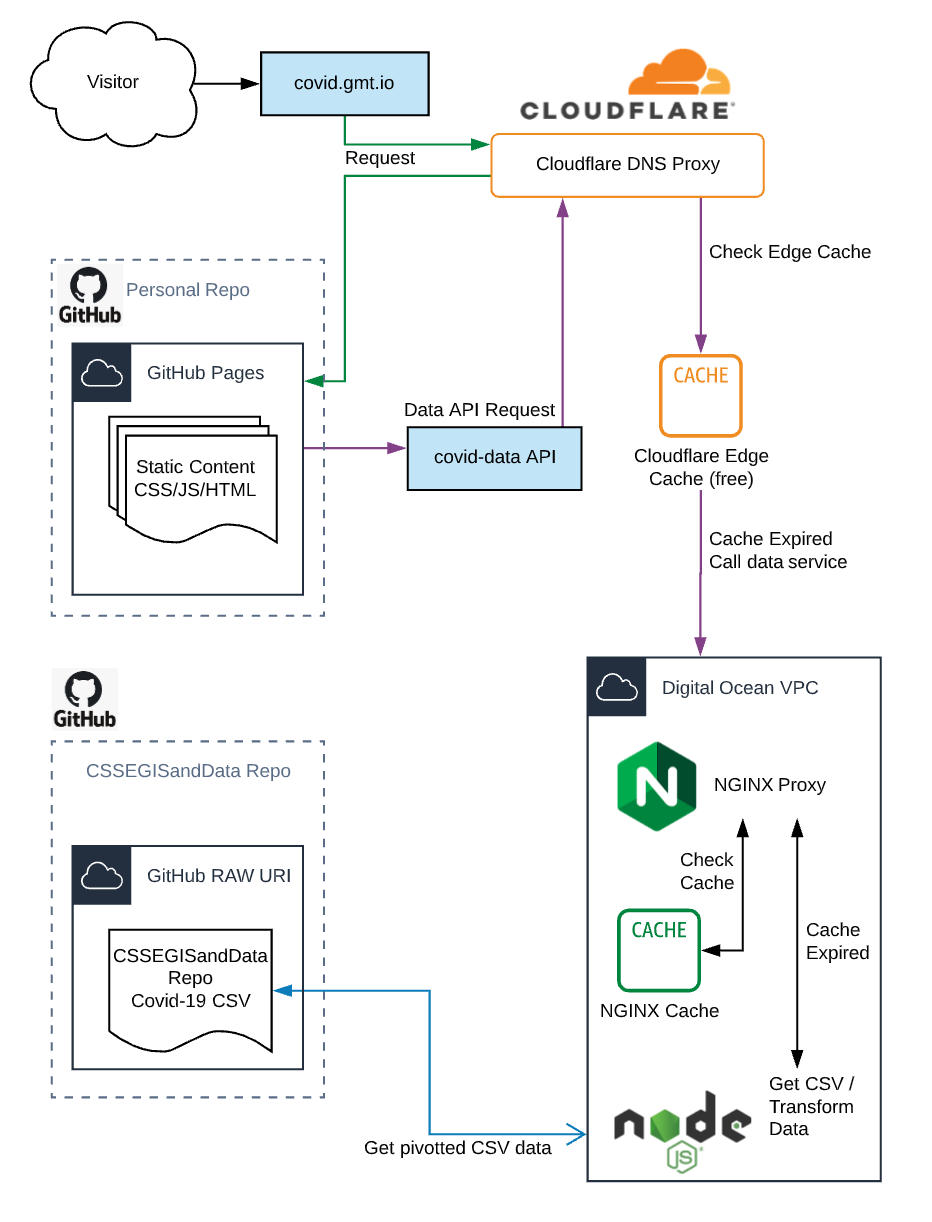
- Request comes into Cloudflare's proxy service (which will return a cached version if it hasn't expired - or forced)
- No cache? Cloudflare proxy calls my nginx server for the HTML page
- Nginx responds with the map HTML
Edit: this is now hosted on Github Pages because, why not. Less load on my server - Browser calls Cloudflare proxy endpoint for map data
- Cloudflare cache => nginx proxy cache => nginx proxy => nodejs app service
- NodeJS gets the latest dataset from the Github CSV raw URL and processes the data, unpivoting, filtering and generating a dataset for the ArcGIS Map to process.
- NodeJS returns a g-zip compressed payload back up the chain, caching the response in the process.

Now that this is all done and deployed, I'm playing around with some animation techniques and other things (popups on hover, etc.), so if you visit https://covid.gmtaz.com and weird stuff is going on, that's probably why.
I've open sourced the repo as well: https://github.com/dcinzona/covid/ so feel free to clone / fork / modify as much as you want!
At the end of the day, this entire process was illuminating and fun, and I learned a lot about the ArcGIS mapping platform as well.
Total Cost: $12/mo (0% net new for this project)
Github: $7
Digital Ocean: $5
Hosting Update:
I changed the architecture a bit and am now using Github Pages to host the HTML and static resources, while keeping the data API layer on my Digital Ocean VPC behind much heavier Cloudflare caching. This enables me to further cache the data layer and have the rest of the site easily updated as I build it out and push those changes up to the repo.
Fewer deployments (only when the API layer changes), and better caching. Win win.
Another quick note:
Caching also (obviously, now that I think about it) caches the response headers. I'm using some regex rules to set the CORS Allowed Origins to set the value to whatever the requesting site is (if it falls within a range of my domains). However, because this was being set dynamically, if I purged the cache and then loaded the API data by hitting the endpoint directly, rather than through covid.gmt.io, the cached allowed origin would be the API endpoint domain and not covid.gmt.io. I might just update the nginx config to specify the allowed origins, rather than making it dynamic based on a ruleset...
Update (December 3rd, 2020):
I disabled the auto-build functionality on my Digital Ocean build server due to how large the Github repo (git log history size) and processing CPU utilization was hitting 100%. So now I randomly manually build it on my personal laptop and push the changes.
